
The project I am currently working on involves a lot of Javascript code to validate values entered by the users and to ensure that business rules are followed in complex forms. Unfortunately, and as everyone knows, it is tough like the hell to develop and debug Javascript code.
However, I recently found an article talking about a tool that was just under my nose and that I was not aware of. Here, I speak about the Microsoft Script Debugger. And, in this, it is a real little pearl. Working with Visual Studio since long time, I knew it was possible to debug Javascript code by attaching the Internet Explorer process, but the files needed to be local. Otherwise it is impossible.
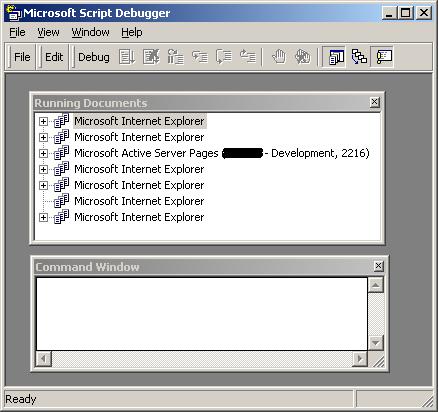
But, the Microsoft Script Debugger tries to find all Internet Explorer sessions and, by selecting the instance you want, it is then possible to do a “Break At Next Statement”. The next line which will be executed will switch you to the debugger window allowing you to execute the application step by step. It is even possible to watch the values held by the variables. You don’t need to have the files locally and it allows you to debug a production environment as well where it is not possible to access the source code.
Well I would not say I am going the best friend of Javascript, but at least, it makes this task less tough. This application is in the Start menu, under Programs, Accessories, Microsoft Script Debugger. With Windows 2000, if it is not there, it just need to be installed from the Windows 2000 version, as a Windows component.
For the other Windows versions, please follow this link.
0 Comments